
Run · Cash, week by week
How to build a 13-week cash flow forecast and use it every Monday
Monthly forecasts hide the week your payroll and a tax bill land together. A 13-week cash flow shows it. How to build one, how to roll it every Monday, and how one company found its problem week before it arrived.
By The Financial Mastery Team · Updated October 26, 2026 · 5 min read
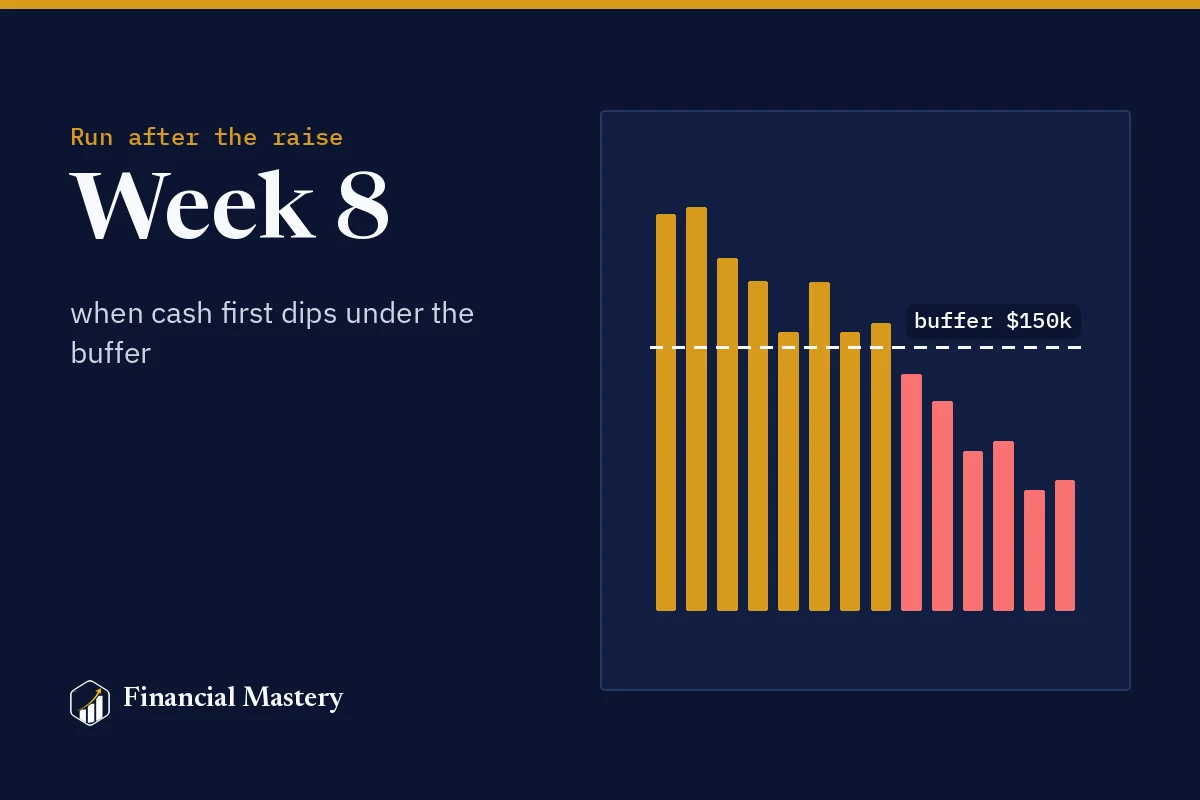
Your monthly forecast says you'll end the quarter with $74,000. That's true. It's also true that there's a week in the middle where you'd have to choose between payroll and the tax bill, and the monthly view never shows it.
That's the gap a 13-week cash flow forecast closes. It's the tool lenders, boards and turnaround advisers ask for first, and it's one of the simplest things in finance to build. This guide walks through one company's quarter.
The quick answer
A 13-week cash flow forecast is a week-by-week, cash-only view of the next quarter: what lands in the bank, what leaves it and what's left at the end of each week. You update it every Monday, compare last week's forecast with what actually happened and add a new week at the end, so you always see 13 weeks ahead.
Why weekly, why 13
Weekly because cash problems happen in weeks, not months. Payroll every two weeks, a quarterly tax payment, an annual renewal and one late customer can all land in the same seven days.
Thirteen because it's a quarter: far enough ahead to act (delay a hire, chase an invoice, open a credit line), near enough that the numbers are mostly known rather than guessed.
Cash-only because it's not a P&L. No depreciation, no accruals, no revenue recognition. Money in, money out, on the day it actually moves.
A worked example
A company that raised last year has:
- $226k in the bank and a $150k minimum buffer it won't go below
- About $11k of customer receipts a week, growing 1% a week
- $6.5k a week of other payments (suppliers, software, rent)
- $34k of payroll every two weeks
- Three known one-offs: an $18k annual software renewal in week 3, a $24k customer invoice landing in week 5, a $21k quarterly tax payment in week 9
Here's how the quarter plays out:
| Week | Receipts | Payments | One-offs | Closing cash |
|---|---|---|---|---|
| 1 | $11.0k | $6.5k | $230.5k | |
| 2 | $11.1k | $40.5k | $201.1k | |
| 3 | $11.2k | $6.5k | −$18.0k | $187.8k |
| 4 | $11.3k | $40.5k | $158.7k | |
| 5 | $11.4k | $6.5k | +$24.0k | $187.6k |
| 6 | $11.6k | $40.5k | $158.7k | |
| 7 | $11.7k | $6.5k | $163.8k | |
| 8 | $11.8k | $40.5k | $135.1k | |
| 9 | $11.9k | $6.5k | −$21.0k | $119.6k |
| 10 | $12.0k | $40.5k | $91.1k | |
| 11 | $12.2k | $6.5k | $96.7k | |
| 12 | $12.3k | $40.5k | $68.5k | |
| 13 | $12.4k | $6.5k | $74.4k |
What the table tells the founders that the monthly view didn't:
- Cash first drops below the $150k buffer in week 8, a payroll week.
- It stays below the buffer for 6 of the 13 weeks.
- The low point is $68.5k in week 12, again a payroll week.
- Average burn is about $11.7k a week, so the $74k left at week 13 is roughly six more weeks of cash. That's the number that should start a conversation today, not in week 12.
Try it with your own numbers
13-Week Cash Flow Check
Model the fix before you need it
The value of a 13-week forecast is that you see the problem with weeks to spare. Here's what three changes do to the same quarter:
| Change | Lowest week | Weeks below buffer |
|---|---|---|
| No change | $68.5k | 6 |
| Collect a $40k overdue invoice in week 6 | $108.5k | 4 |
| Delay a hire, saving $8k per payroll from week 6 | $100.5k | 5 |
| Both | about $140k | still below in the payroll weeks |
None of these alone keeps the company above its buffer. Together they buy enough time to raise, to arrange a credit line or to make a bigger decision calmly. That's the purpose: turn a surprise into a plan.
Enter cash on the day it lands
The most common mistake is entering an invoice on the week you send it. If a customer pays on 30-day terms, the receipt belongs four weeks later. Timing is the whole point of a 13-week view.
How to build yours in an afternoon
- Start with today's bank balance. Not the accounting balance; what the bank says.
- List receipts by week. Use your accounts receivable aging: who owes what, and when they've actually paid in the past.
- List payments by week. Payroll dates, rent, loan repayments, supplier runs, card bills, taxes.
- Add the one-offs you already know about. Renewals, deposits, equipment, legal fees.
- Set a buffer. The lowest balance you'd be comfortable holding, often a month or two of payroll.
- Flag every week below it. Those are the weeks that need a plan.
The Monday routine
A 13-week forecast is only useful if it's current. Each Monday:
- Enter last week's actuals next to last week's forecast.
- Look at the variance. Were receipts late? Did a payment come early? Variances that repeat are a forecasting problem; fix the assumption.
- Drop the old week, add a new week 13.
- Check the low point and the buffer weeks. Did either move?
- Send a two-line update to your co-founder, or your board if cash is tight.
Twenty minutes a week. It's the cheapest insurance a founder can buy.
How it fits with your other forecasts
The 13-week view sits underneath your monthly model, not instead of it. The monthly model answers "how long is our runway and how much do we need to raise?" (see startup runway: how much is enough). The 13-week view answers "can we make every payment this quarter, and which week is tight?" Your board wants both, alongside budget vs actuals; the variance calculator covers that third view.
To see the routine in practice, the case studies include an AI company whose Monday 13-week forecast absorbed a 19% cost overrun after a large customer launched early.
In the kit · Financial Mastery Premium · $997
Run your 13 weeks with levers, not guesses
The Premium kit's 13-Week Cash Flow adds receipts by customer, payment runs, scenario levers and a rolling actuals column, next to Budget vs Actuals with a live reforecast and a KPI Board Dashboard. The Runway & Cash Survival Playbook walks you through what to do when the line dips.
80 files, 24 PDF books. Works in Excel, Google Sheets and LibreOffice. The kit page shows the full contents and the first 12 pages of its Launch Plan.

Prefer to start free? Open the calculator or find the kit that fits.
Keep reading
Run the company · 3 min
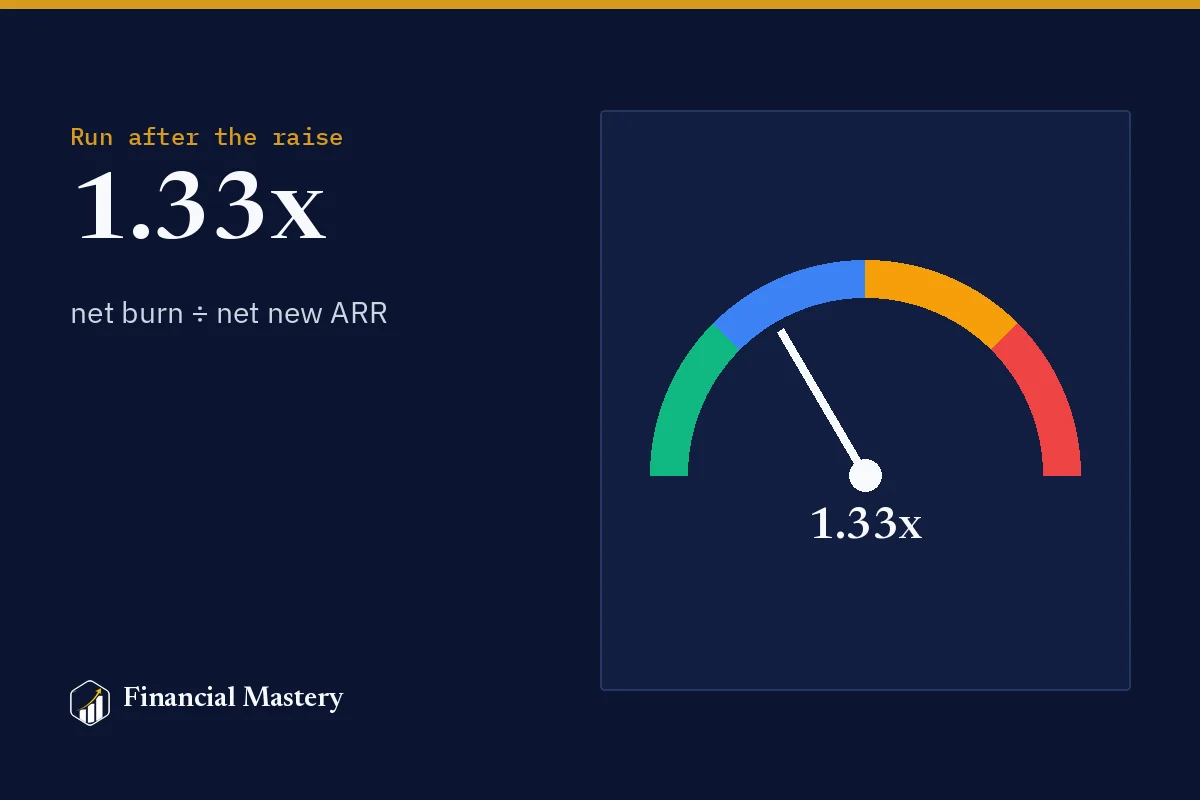
Burn multiple is the ratio your next investor will calculate
Net burn divided by net new ARR. Simple to calculate, hard to fake, and the quickest read on whether your growth is worth what it costs. With worked examples, the usual ranges and what moves it.
May 18, 2026
Build the model · 4 min
What investors check in your financial model in the first ten minutes
Analysts don't read your model top to bottom. They run a short sequence of checks, and the first failure colours everything after it. Here's that sequence, with the numbers they look for.
April 13, 2026
Plan the raise · 4 min
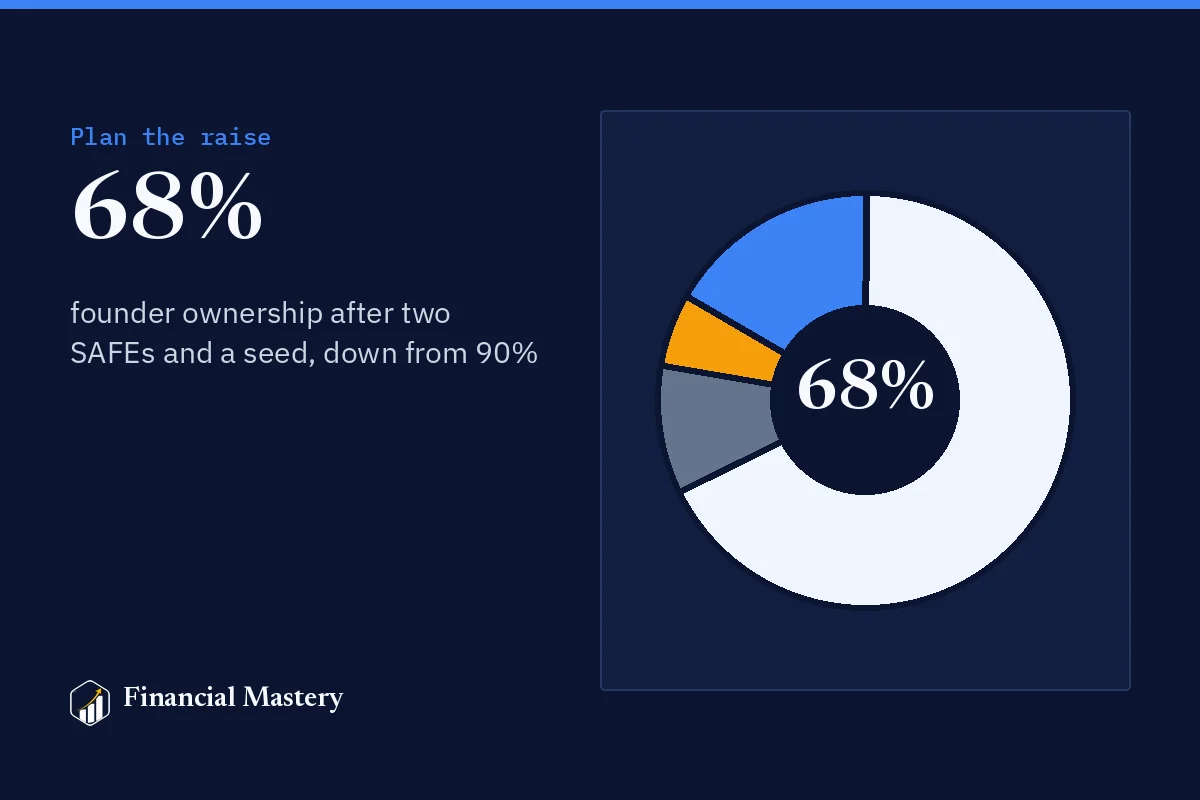
How post-money SAFEs dilute founders, shown on one cap table
Two SAFEs, a $2M priced round and an option pool top-up: follow every share from 90% founder ownership to about 68%, and see which SAFE term actually decides the price each investor pays.
March 9, 2026