
Raise · SAFEs and the cap table
How post-money SAFEs dilute founders, shown on one cap table
Two SAFEs, a $2M priced round and an option pool top-up: follow every share from 90% founder ownership to about 68%, and see which SAFE term actually decides the price each investor pays.
By The Financial Mastery Team · Updated October 26, 2026 · 4 min read
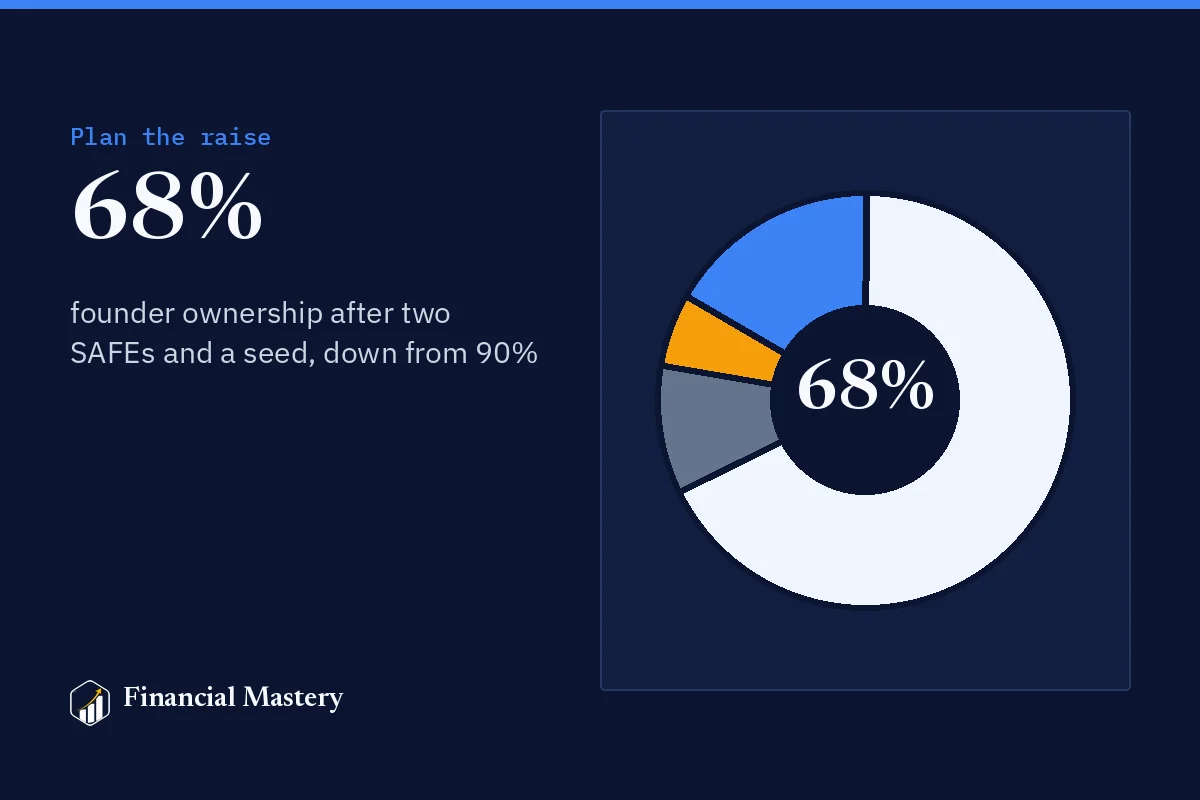
A SAFE feels free when you sign it. There's no valuation, no board seat and no shares changing hands. The cost shows up later, all at once, on the day your first priced round closes. This is what that day looks like.
We'll follow one company through two SAFEs and a seed round. Every number comes from the free calculator below, so you can replace them with your own as you read.
The quick answer
A post-money SAFE converts so the investor owns roughly their investment divided by the post-money valuation cap, measured just before the new round. Because the cap is post-money, each SAFE you add dilutes the founders, not the SAFE holders who came before. Then the priced round and any option pool top-up dilute everyone, including the SAFEs.
The starting cap table
| Holder | Shares | Ownership |
|---|---|---|
| Founders | 9,000,000 | 90% |
| Option pool (unissued) | 1,000,000 | 10% |
| Total | 10,000,000 | 100% |
Then the company raises two SAFEs:
- Accelerator: $150k on a post-money SAFE with a $6M cap
- Angels: $350k on a post-money SAFE with an $8M cap and a 20% discount
On a post-money SAFE, the arithmetic for each holder's stake before the round is clean: $150k ÷ $6M = 2.5% and $350k ÷ $8M = 4.375%. Together the SAFEs have been promised about 6.9% of the company. The founders have given that up already, before any priced round exists.
The trap
With pre-money SAFEs, later SAFEs diluted earlier ones too, which spread the cost. With post-money SAFEs, every new SAFE comes straight out of the founders' and common holders' share. Three or four small SAFEs add up faster than most founders expect.
The seed round arrives
Eighteen months later, a lead investor offers:
- $2M of new money
- at a $10M pre-money valuation
- with the option pool topped up to 10% after the round
Three things now happen in the pre-money, before the new money goes in:
- The SAFEs convert. Each converts at the best price available to it: the round price, its cap price or its discount price.
- The pool is topped up. About 330,000 new options are created so the pool is 10% after the round.
- The round price is set: pre-money ÷ all of those shares = about $0.90 per share.
Then the new investors buy $2M of shares at that price.
Try it with your own numbers
SAFE Conversion & Dilution Calculator
Which SAFE term actually won?
This is the detail that surprises people:
| SAFE | Price paid per share | vs round price |
|---|---|---|
| Accelerator ($6M cap) | $0.56 | 38% lower |
| Angels ($8M cap, 20% discount) | $0.72 | 20% lower |
The accelerator's cap is far below the $10M round, so the cap decides its price. The angels' $8M cap would give them about $0.74 a share; the 20% discount gives them $0.72, which is better for them, so the discount wins. A SAFE gets whichever term is best for the investor, and you can't tell which one that is until you know the round price.
The cap table after the round
| Holder | Ownership after |
|---|---|
| Founders | 67.7% |
| Option pool (existing + top-up) | 10.0% |
| Accelerator SAFE | 2.0% |
| Angels SAFE | 3.6% |
| Seed investors | 16.7% |
Founders went from 90% to about 68%. Notice the SAFEs ended below the 6.9% they were promised: the new money and the pool top-up diluted them too. The new investors own exactly $2M ÷ $12M post-money = 16.7%.
Three changes, three different outcomes
Same company, one change at a time:
| Scenario | Founders after |
|---|---|
| As above | 67.7% |
| No pool top-up asked for | 69.8% |
| Pool target of 15% instead of 10% | 62.8% |
| One more $250k SAFE at a $10M post-money cap | 65.6% |
The pool target cost the founders more than the extra SAFE did. That's the option pool shuffle: a bigger pool created in the pre-money lowers your effective valuation without changing the headline number. Negotiate the pool against a real hiring plan for the next 18 months, not a round percentage.
What to do before you sign your next SAFE
- Model it first. Add it to your cap table with a realistic next-round price and see the founder line move.
- Keep a running total of what you've promised. Sum amount ÷ cap for every post-money SAFE. If it's heading past 15 to 20%, slow down.
- Check pre or post. The same cap means very different things on a pre-money and a post-money SAFE. Read the document's title.
- Match the documents exactly. Investors' lawyers will rebuild your cap table in diligence. If yours differs, you'll be explaining it under time pressure.
- Think two rounds ahead. What you own after the seed matters less than what you own after the Series A. The dilution calculator shows the path from seed to Series B.
The term sheet decoder covers the other clauses that affect what you actually own, from pro-rata rights to liquidation preferences.
In the kit · Financial Mastery Starter · $297
Model every SAFE before you sign it
The Starter kit's cap table handles post- and pre-money SAFEs, convertible notes with interest, three priced rounds, pro-rata and an exit waterfall, with a solver that settles every conversion. Change one cap and see founder ownership move.
18 files, 9 PDF books. Works in Excel, Google Sheets and LibreOffice. The kit page shows the full contents and the first 12 pages of its Launch Plan.

Prefer to start free? Open the calculator or find the kit that fits.
Keep reading
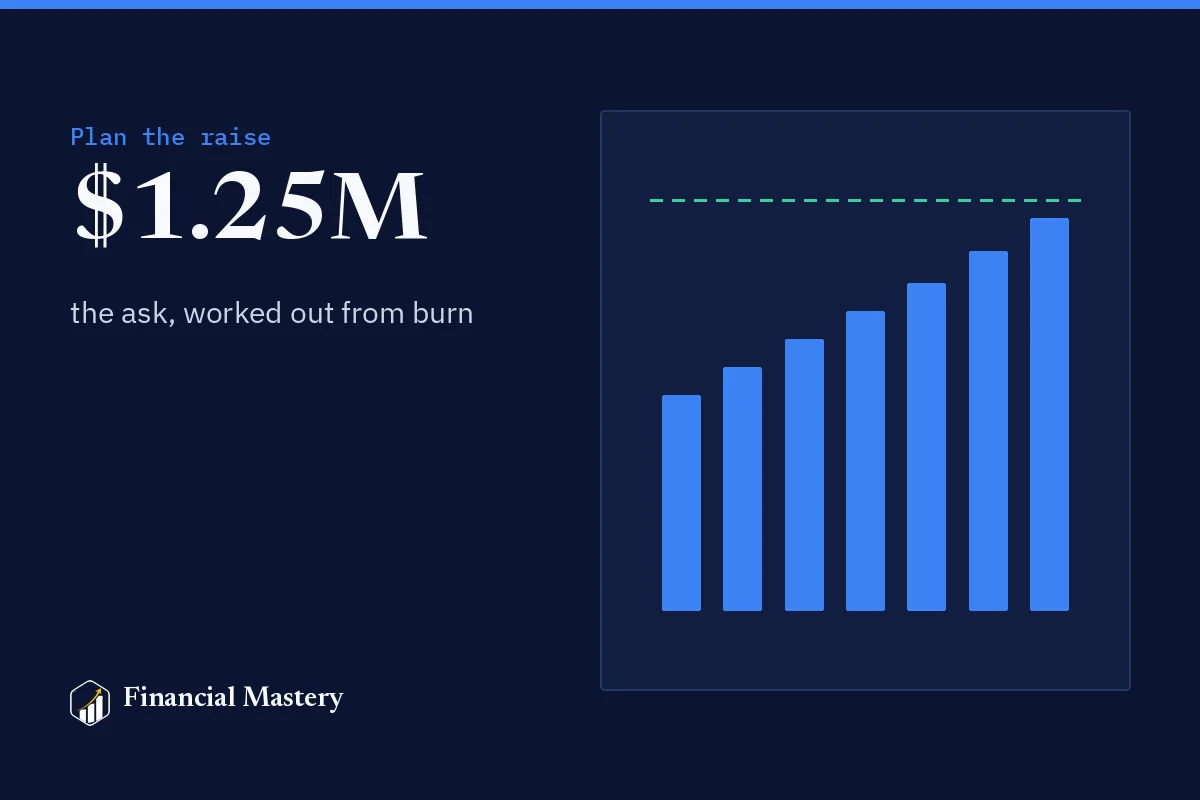
Plan the raise · 4 min
How much should a startup raise? Work it out from burn
Your round size should come from three numbers: how fast you'll spend after the round, how long you need, and how much you'll burn while you raise. A worked example from $300k in the bank to a $1.25M ask.
February 2, 2026
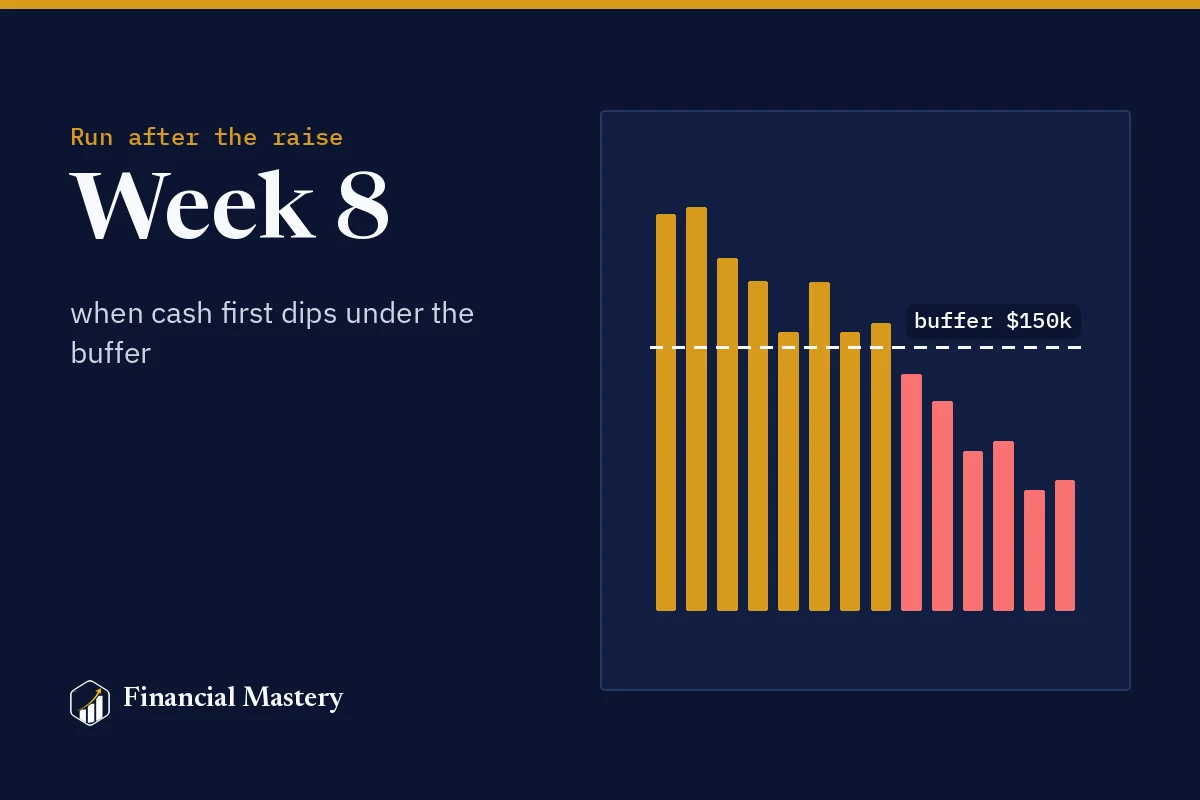
Run the company · 5 min
How to build a 13-week cash flow forecast and use it every Monday
Monthly forecasts hide the week your payroll and a tax bill land together. A 13-week cash flow shows it. How to build one, how to roll it every Monday, and how one company found its problem week before it arrived.
July 6, 2026
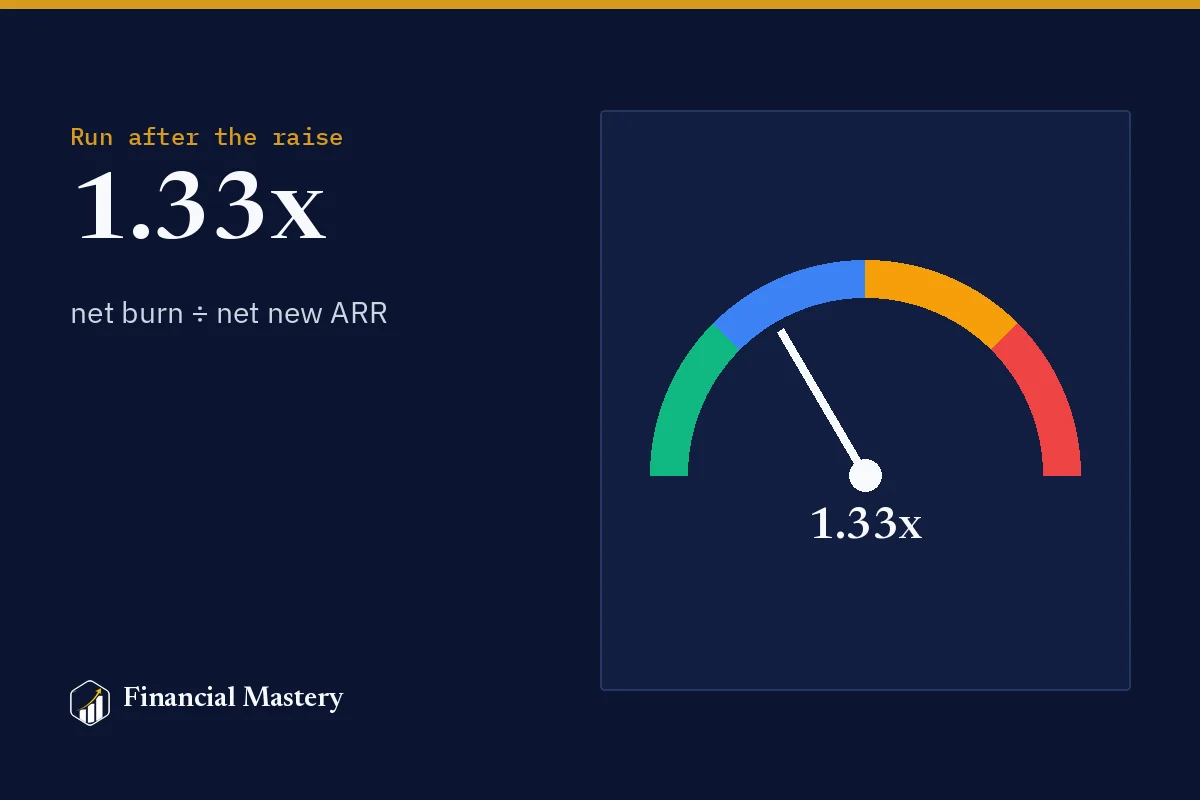
Run the company · 3 min
Burn multiple is the ratio your next investor will calculate
Net burn divided by net new ARR. Simple to calculate, hard to fake, and the quickest read on whether your growth is worth what it costs. With worked examples, the usual ranges and what moves it.
May 18, 2026