
Run · Efficiency after the raise
Burn multiple is the ratio your next investor will calculate
Net burn divided by net new ARR. Simple to calculate, hard to fake, and the quickest read on whether your growth is worth what it costs. With worked examples, the usual ranges and what moves it.
By The Financial Mastery Team · Updated October 26, 2026 · 3 min read
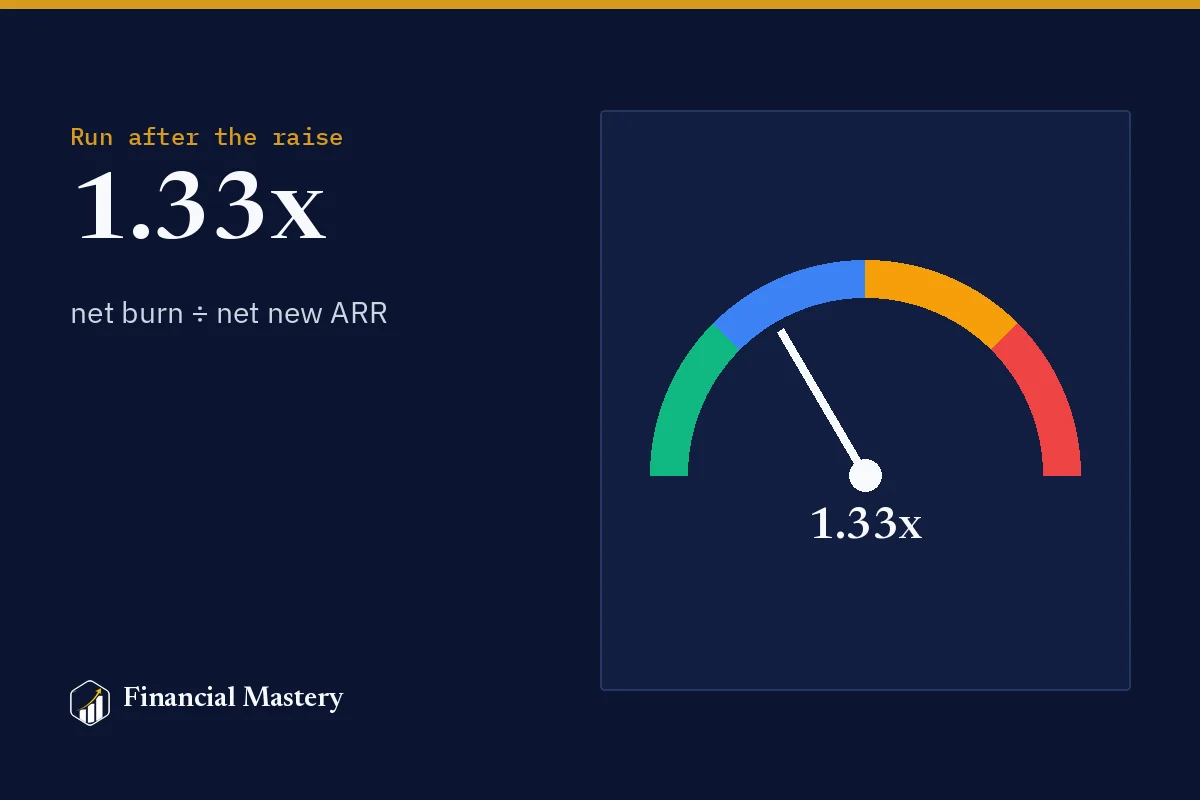
After the round, the questions change. Before, investors asked whether you could grow. Now they ask what your growth costs. Burn multiple is how they ask it in a single number.
The quick answer
Burn multiple = net burn ÷ net new ARR over the same period. It tells you how many dollars of cash you burn to add one dollar of recurring revenue. For a venture-backed SaaS company, under 1x is exceptional, 1 to 1.5x is great, 1.5 to 2x is good, 2 to 3x deserves a closer look and above 3x is a warning sign.
A worked example
Over the last twelve months, a company:
- burned $1.2M of cash (costs minus revenue, before any new funding), and
- grew ARR from $0.9M to $1.8M, so added $0.9M of net new ARR.
Burn multiple = $1.2M ÷ $0.9M = 1.33x. For every dollar of new ARR, the company spent $1.33. That's in the "great" range.
Try it with your own numbers
Burn Multiple and Rule of 40 Calculator
Why investors like it
Most efficiency metrics look at one slice of the business. CAC payback looks only at sales and marketing. Gross margin looks only at the cost of delivering the product. Burn multiple uses all the cash you burn, product, G&A, the hires you made ahead of growth, and sets it against the growth you got.
That makes it hard to flatter. You can't improve it by moving costs between departments, and one-off revenue doesn't count because it isn't ARR.
Three companies, same burn
Here's why the ratio matters more than either number alone:
| Company | Net burn | Net new ARR | Burn multiple |
|---|---|---|---|
| A | $1.2M | $0.9M | 1.33x · great |
| B | $1.2M | $0.4M | 3.0x · bad |
| C | $1.2M | $1.4M | 0.86x · amazing |
All three burned the same amount. Only one of them will find the Series A easy. Company B isn't necessarily a bad business, but it needs to show why the next dollar will buy more growth than the last one did.
Churn is hiding inside the denominator
Net new ARR is new ARR minus churned and contracted ARR. That's why burn multiple moves when retention moves, even if sales are on plan.
Suppose Company A won $1.2M of new and expansion ARR and lost $0.3M to churn: net new ARR $0.9M, multiple 1.33x. If churn had doubled to $0.6M, net new ARR would fall to $0.6M, and the multiple would jump to 2.0x, with no change in spending or sales at all.
Before you cut growth spend
When the multiple rises, check churn and CAC first. Cutting marketing lowers burn, but if it also cuts new ARR by the same proportion, the multiple doesn't improve. Fixing retention often improves it more, faster.
The Rule of 40, briefly
The other number you'll hear is the Rule of 40: ARR growth rate plus profit margin. Our example company grew 100% with a −45% margin, so it scores 55, above the 40 line.
The Rule of 40 is mostly used for scaled software companies, usually above $10M of ARR. At seed and Series A, investors care more about growth, retention and burn multiple. It's worth knowing your score; it's rarely worth optimising for it this early.
How to measure it without fooling yourself
- Use a full year, or a quarter annualised. Single months swing on one large deal or one annual bill.
- Use net burn before funding. New money from investors isn't revenue.
- Count recurring revenue only. Setup fees and services don't belong in ARR.
- Track the trend. A multiple falling from 2.5x to 1.8x over three quarters tells a better story than a flat 1.5x.
- Show it next to runway. A board wants to know what you're buying and how long you can keep buying it. The runway calculator gives you the second half.
Where it fits in your reporting
Burn multiple belongs on the first page of your board pack, next to ARR, growth, net revenue retention, cash and runway. Those six numbers answer most of what a board asks before the meeting starts. The Series A readiness scorecard puts efficiency alongside growth, retention, team and the other areas investors score you on.
To see a company reporting these numbers after its raise, the case studies follow three companies from first model to board pack.
In the kit · Financial Mastery Premium · $997
Put burn multiple on your board pack every quarter
The Premium kit's KPI Board Dashboard tracks burn multiple, growth, retention and runway against your targets, and builds a quarterly board pack from the same numbers. Budget vs Actuals and a 13-week cash flow sit alongside it.
80 files, 24 PDF books. Works in Excel, Google Sheets and LibreOffice. The kit page shows the full contents and the first 12 pages of its Launch Plan.

Prefer to start free? Open the calculator or find the kit that fits.
Keep reading
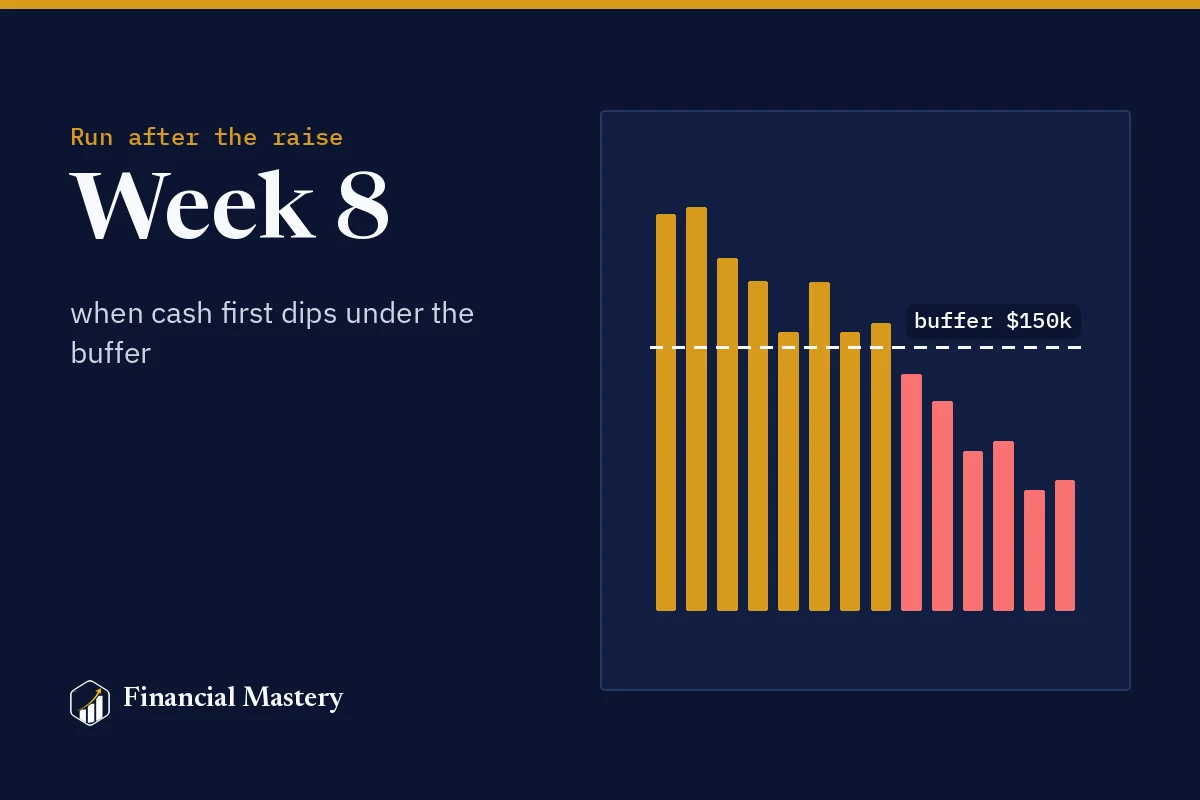
Run the company · 5 min
How to build a 13-week cash flow forecast and use it every Monday
Monthly forecasts hide the week your payroll and a tax bill land together. A 13-week cash flow shows it. How to build one, how to roll it every Monday, and how one company found its problem week before it arrived.
July 6, 2026
Build the model · 4 min
What investors check in your financial model in the first ten minutes
Analysts don't read your model top to bottom. They run a short sequence of checks, and the first failure colours everything after it. Here's that sequence, with the numbers they look for.
April 13, 2026
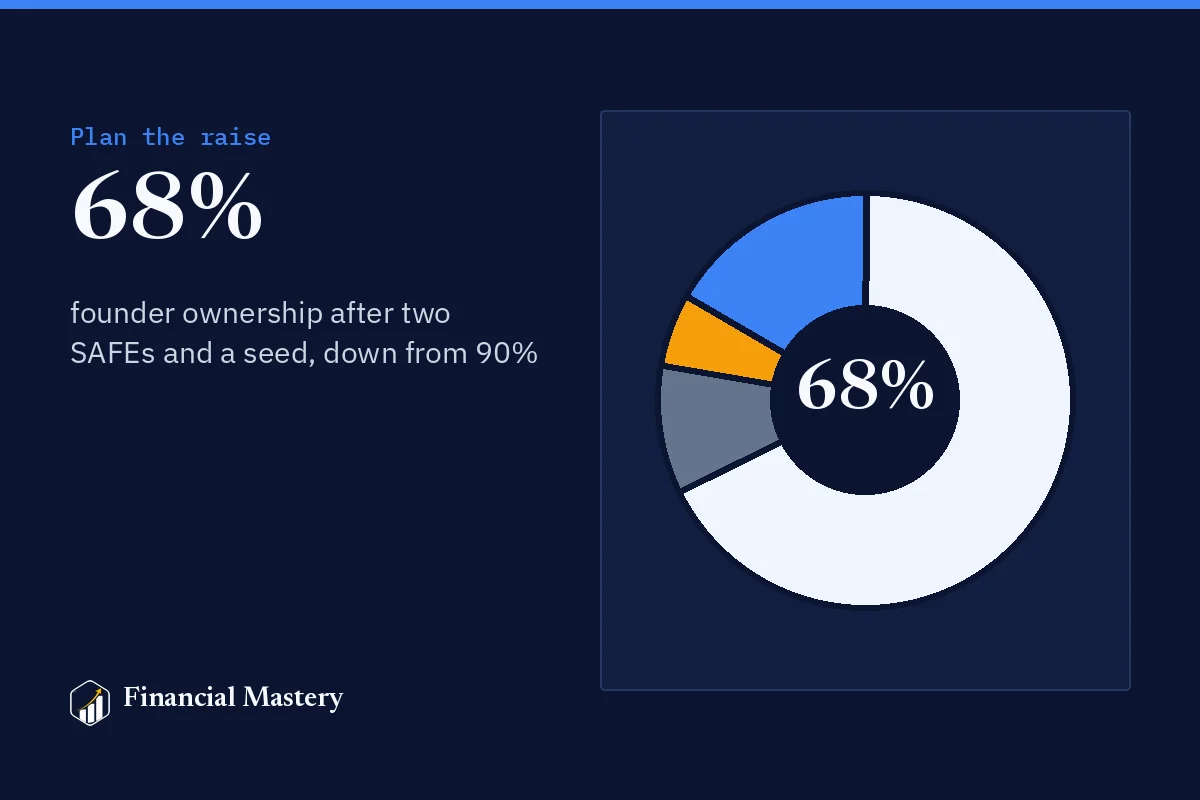
Plan the raise · 4 min
How post-money SAFEs dilute founders, shown on one cap table
Two SAFEs, a $2M priced round and an option pool top-up: follow every share from 90% founder ownership to about 68%, and see which SAFE term actually decides the price each investor pays.
March 9, 2026